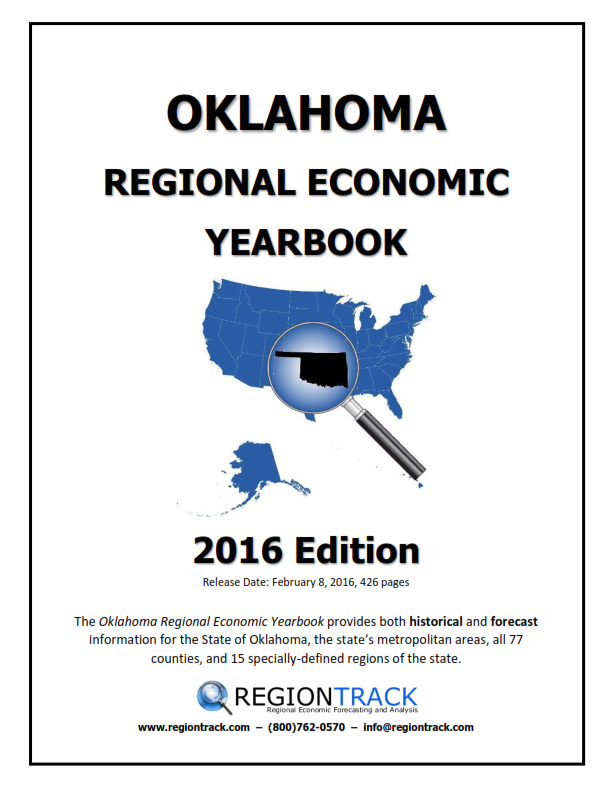
The 2016 [tooltip title=”Your best resource for data on the Oklahoma economy!”]Oklahoma Regional Economic Yearbook[/tooltip] is here!
The Yearbook is the most comprehensive and trusted source for historical and forecast information on the Oklahoma economy!
[/fusion_text][/fullwidth][fullwidth background_color=”#fff” background_image=”” background_parallax=”fixed” enable_mobile=”no” parallax_speed=”0.3″ background_repeat=”no-repeat” background_position=”left top” video_url=”” video_aspect_ratio=”16:9″ video_webm=”” video_mp4=”” video_ogv=”” video_preview_image=”” overlay_color=”” overlay_opacity=”0.5″ video_mute=”yes” video_loop=”yes” fade=”no” border_size=”1px” border_color=”#f6f6f6″ border_style=”solid” padding_top=”20px” padding_bottom=”20px” padding_left=”0px” padding_right=”0px” hundred_percent=”no” equal_height_columns=”no” hide_on_mobile=”no” menu_anchor=”” class=”” id=””][one_half last=”no” spacing=”yes” center_content=”no” hide_on_mobile=”no” background_color=”” background_image=”” background_repeat=”no-repeat” background_position=”left top” hover_type=”none” link=”” border_position=”all” border_size=”0px” border_color=”” border_style=”” padding=”” margin_top=”” margin_bottom=”” animation_type=”” animation_direction=”” animation_speed=”0.1″ animation_offset=”” class=”” id=””][fusion_text]More than [tooltip title=”Comprehensive data coverage”]400 pages of historical and forecast data tables[/tooltip] at your fingertips! All areas of the state are covered – [tooltip title=”All regions of the state”]state, metros, and counties[/tooltip], along with [tooltip title=”e.g., energy, agriculture, and manufacturing regions”]15 specially-defined regions[/tooltip] of the state.
[/fusion_text][separator style_type=”single” top_margin=”5″ bottom_margin=”25″ sep_color=”” border_size=”” icon=”” icon_circle=”” icon_circle_color=”” width=”” alignment=”” class=”” id=””][fusion_text][tooltip title=”Statewide, metro areas, counties, & special regions”]Comprehensive Coverage of the Oklahoma Economy[/tooltip]
[/fusion_text][checklist icon=”fa-star” iconcolor=”dark” circle=”no” circlecolor=”” size=”small” class=”” id=””][li_item icon=””]In-depth coverage of the Oklahoma City and Tulsa metro areas[/li_item][li_item icon=””]Detailed data tables for all 77 counties[/li_item][li_item icon=””]Fifteen specially-defined regions of the state – metro areas, micropolitan areas, energy counties, agricultural counties, etc…[/li_item][li_item icon=””]County ranking tables provide a useful benchmark of local performance[/li_item][li_item icon=””]Fifteen data tables at the state level[/li_item][/checklist][/one_half][one_half last=”yes” spacing=”yes” center_content=”no” hide_on_mobile=”no” background_color=”#f7f7f7″ background_image=”” background_repeat=”no-repeat” background_position=”left top” hover_type=”none” link=”” border_position=”all” border_size=”0px” border_color=”” border_style=”solid” padding=”” margin_top=”” margin_bottom=”” animation_type=”0″ animation_direction=”down” animation_speed=”0.1″ animation_offset=”” class=”” id=””][fusion_text] [/fusion_text][/one_half][/fullwidth][fullwidth background_color=”#fff” background_image=”https://www.regiontrack.com/www/wp-content/uploads/iStock_000012047633_Medium-1024×1024.jpg” background_parallax=”fixed” enable_mobile=”no” parallax_speed=”0.3″ background_repeat=”no-repeat” background_position=”center center” video_url=”” video_aspect_ratio=”16:9″ video_webm=”” video_mp4=”” video_ogv=”” video_preview_image=”” overlay_color=”” overlay_opacity=”0.5″ video_mute=”yes” video_loop=”yes” fade=”no” border_size=”1px” border_color=”#dadada” border_style=”solid” padding_top=”20px” padding_bottom=”20px” padding_left=”0px” padding_right=”0px” hundred_percent=”no” equal_height_columns=”no” hide_on_mobile=”no” menu_anchor=”” class=”” id=””][fusion_text]
How Will Your Region Perform in 2016?
Detailed 2016 forecast information for all regions of the state.
[/fusion_text][/fullwidth][fullwidth background_color=”” background_image=”” background_parallax=”fixed” enable_mobile=”no” parallax_speed=”0.3″ background_repeat=”no-repeat” background_position=”left top” video_url=”” video_aspect_ratio=”16:9″ video_webm=”” video_mp4=”” video_ogv=”” video_preview_image=”” overlay_color=”” overlay_opacity=”0.5″ video_mute=”yes” video_loop=”yes” fade=”no” border_size=”1px” border_color=”#f6f6f6″ border_style=”solid” padding_top=”20px” padding_bottom=”20px” padding_left=”0px” padding_right=”0px” hundred_percent=”no” equal_height_columns=”no” hide_on_mobile=”no” menu_anchor=”” class=”” id=””][one_half last=”no” spacing=”yes” center_content=”no” hide_on_mobile=”no” background_color=”” background_image=”” background_repeat=”no-repeat” background_position=”left top” hover_type=”none” link=”” border_position=”all” border_size=”0px” border_color=”” border_style=”solid” padding=”” margin_top=”” margin_bottom=”” animation_type=”0″ animation_direction=”down” animation_speed=”0.1″ animation_offset=”” class=”” id=””][title size=”2″ content_align=”left” style_type=”default” sep_color=”” margin_top=”” margin_bottom=”” class=”” id=””][tooltip title=””]Evaluating Your Region’s Economy Has Never Been Easier[/tooltip]
[/title][checklist icon=”fa-star” iconcolor=”dark” circle=”no” circlecolor=”” size=”small” class=”” id=””][li_item icon=””]Forecasts for 2016 are provided for all regions and most data series[/li_item][li_item icon=””]A comprehensive set of economic indicators for all regions[/li_item][li_item icon=””]Forecasts are derived from RegionTrack’s widely-used Regional Economic Forecasting Model[/li_item][li_item icon=””]Employment and income tables provide detail at the 2-digit NAICS industry level for all regions[/li_item][li_item icon=””]Ranking tables allow for an easy comparison of performance across regions[/li_item][li_item icon=””]Ten years of data describing historical, current, and expected future conditions[/li_item][/checklist][/one_half][one_half last=”yes” spacing=”yes” center_content=”no” hide_on_mobile=”no” background_color=”” background_image=”” background_repeat=”no-repeat” background_position=”left top” hover_type=”none” link=”” border_position=”all” border_size=”0px” border_color=”” border_style=”” padding=”” margin_top=”” margin_bottom=”” animation_type=”” animation_direction=”” animation_speed=”0.1″ animation_offset=”” class=”” id=””][imageframe lightbox=”no” lightbox_image=”” style_type=”none” hover_type=”none” bordercolor=”” bordersize=”0px” borderradius=”0″ stylecolor=”” align=”none” link=”” linktarget=”_self” animation_type=”0″ animation_direction=”down” animation_speed=”0.1″ animation_offset=”” hide_on_mobile=”no” class=”” id=””] [/imageframe][/one_half][/fullwidth][fullwidth background_color=”#fff” background_image=”http://theme-fusion.com/avada/wp-content/uploads/2013/05/page_bkgd3.jpg” background_parallax=”fixed” enable_mobile=”no” parallax_speed=”0.3″ background_repeat=”no-repeat” background_position=”center center” video_url=”” video_aspect_ratio=”16:9″ video_webm=”” video_mp4=”” video_ogv=”” video_preview_image=”” overlay_color=”” overlay_opacity=”0.5″ video_mute=”yes” video_loop=”yes” fade=”no” border_size=”0px” border_color=”#f6f6f6″ border_style=”” padding_top=”30px” padding_bottom=”0px” padding_left=”0px” padding_right=”0px” hundred_percent=”no” equal_height_columns=”no” hide_on_mobile=”no” menu_anchor=”” class=”” id=””][fusion_text]
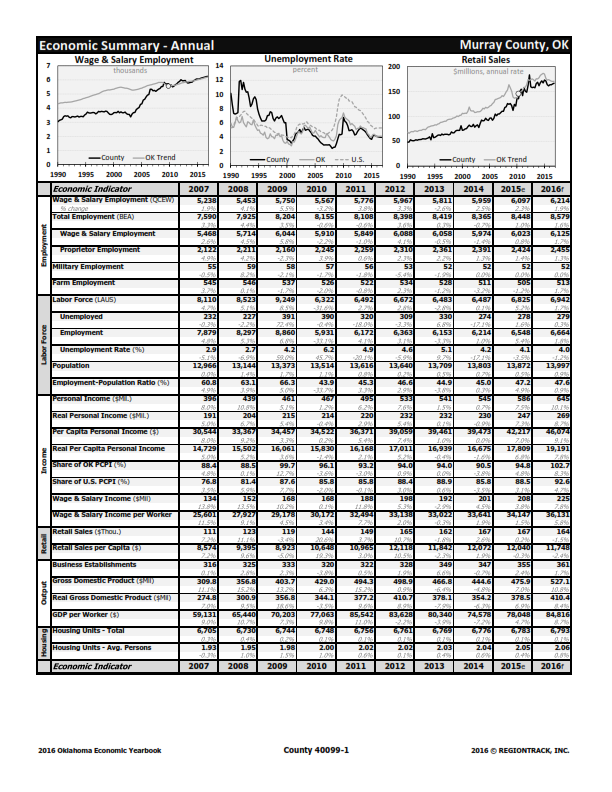
What’s inside the Yearbook?
See some example pages below…
[/fusion_text][images picture_size=”fixed” hover_type=”none” autoplay=”no” columns=”5″ column_spacing=”13″ scroll_items=”” show_nav=”yes” mouse_scroll=”no” border=”yes” lightbox=”yes” class=”” id=””][image link=”” linktarget=”_self” image=”https://www.regiontrack.com/www/wp-content/uploads/state-intro_014.png” alt=””][image link=”” linktarget=”_self” image=”https://www.regiontrack.com/www/wp-content/uploads/ok_state_summ_ann_015.png” alt=””][image link=”” linktarget=”_self” image=”https://www.regiontrack.com/www/wp-content/uploads/state-desc_006.png” alt=””][image link=”” linktarget=”_self” image=”https://www.regiontrack.com/www/wp-content/uploads/metro-intro_019_019.png” alt=””][image link=”” linktarget=”_self” image=”https://www.regiontrack.com/www/wp-content/uploads/okc_msa_qcew_wage.png” alt=””][image link=”” linktarget=”_self” image=”https://www.regiontrack.com/www/wp-content/uploads/county-intro_022_022.png” alt=””][image link=”” linktarget=”_self” image=”https://www.regiontrack.com/www/wp-content/uploads/county50_001.png” alt=””][image link=”” linktarget=”_self” image=”https://www.regiontrack.com/www/wp-content/uploads/county50_002.png” alt=””][image link=”” linktarget=”_self” image=”https://www.regiontrack.com/www/wp-content/uploads/county50_003.png” alt=””][image link=”” linktarget=”_self” image=”https://www.regiontrack.com/www/wp-content/uploads/county50_004-e1455684759499.png” alt=””][image link=”” linktarget=”_self” image=”https://www.regiontrack.com/www/wp-content/uploads/special-intro_027_027.png” alt=””][image link=”” linktarget=”_self” image=”https://www.regiontrack.com/www/wp-content/uploads/special-regions_009.png” alt=””][image link=”” linktarget=”_self” image=”https://www.regiontrack.com/www/wp-content/uploads/unrate-rankings_001.png” alt=””][image link=”” linktarget=”_self” image=”https://www.regiontrack.com/www/wp-content/uploads/unrate-rankings_002.png” alt=””][/images][fusion_text]
… or download (pdf) the introduction to the Yearbook along with some example pages.
[/fusion_text][/fullwidth][fullwidth background_color=”#fff” background_image=”” background_parallax=”fixed” enable_mobile=”no” parallax_speed=”0.3″ background_repeat=”no-repeat” background_position=”left top” video_url=”” video_aspect_ratio=”16:9″ video_webm=”” video_mp4=”” video_ogv=”” video_preview_image=”” overlay_color=”” overlay_opacity=”0.5″ video_mute=”yes” video_loop=”yes” fade=”no” border_size=”1px” border_color=”#f6f6f6″ border_style=”solid” padding_top=”15px” padding_bottom=”0px” padding_left=”0px” padding_right=”0px” hundred_percent=”no” equal_height_columns=”no” hide_on_mobile=”no” menu_anchor=”” class=”” id=””][one_half last=”no” spacing=”yes” center_content=”no” hide_on_mobile=”no” background_color=”” background_image=”” background_repeat=”no-repeat” background_position=”left top” hover_type=”none” link=”” border_position=”all” border_size=”0px” border_color=”” border_style=”” padding=”” margin_top=”” margin_bottom=”” animation_type=”” animation_direction=”” animation_speed=”0.1″ animation_offset=”” class=”” id=””][fusion_text] [/fusion_text][/one_half][one_half last=”yes” spacing=”yes” center_content=”no” hide_on_mobile=”no” background_color=”” background_image=”” background_repeat=”no-repeat” background_position=”left top” hover_type=”none” link=”” border_position=”all” border_size=”0px” border_color=”” border_style=”” padding=”” margin_top=”” margin_bottom=”” animation_type=”” animation_direction=”” animation_speed=”0.1″ animation_offset=”” class=”” id=””][fusion_text]
Order your copy of the 2016 Yearbook today!
[/fusion_text][separator style_type=”single” top_margin=”5″ bottom_margin=”25″ sep_color=”” border_size=”” icon=”” icon_circle=”” icon_circle_color=”” width=”” alignment=”” class=”” id=””][fusion_text]Price: $225.00 (electronic edition)Pages: pp. 426
Filesize: 20.8 MB
Format: Adobe (pdf)[/fusion_text][checklist icon=”fa-star” iconcolor=”dark” circle=”no” circlecolor=”” size=”small” class=”” id=””][li_item icon=””]The Yearbook is available for immediate download[/li_item][li_item icon=””]Review the introduction and several sample pages (pdf)[/li_item][/checklist][separator style_type=”none” top_margin=”15″ bottom_margin=”” sep_color=”” border_size=”” icon=”” icon_circle=”” icon_circle_color=”” width=”” alignment=”” class=”” id=””][button link=”https://www.regiontrack.com/account/signup/okeconyrbk” color=”default” size=”large” stretch=”” type=”” shape=”” target=”_self” title=”” gradient_colors=”|” gradient_hover_colors=”|” accent_color=”” accent_hover_color=”” bevel_color=”” border_width=”1px” icon=”fa-external-link-square” icon_position=”left” icon_divider=”no” modal=”” animation_type=”0″ animation_direction=”left” animation_speed=”1″ animation_offset=”” alignment=”” class=”” id=””]Purchase the 2016 Yearbook Now![/button][/one_half][/fullwidth][separator style_type=”none” top_margin=”-25″ bottom_margin=”” sep_color=”” border_size=”” icon=”” icon_circle=”” icon_circle_color=”” width=”” alignment=”” class=”” id=””]
